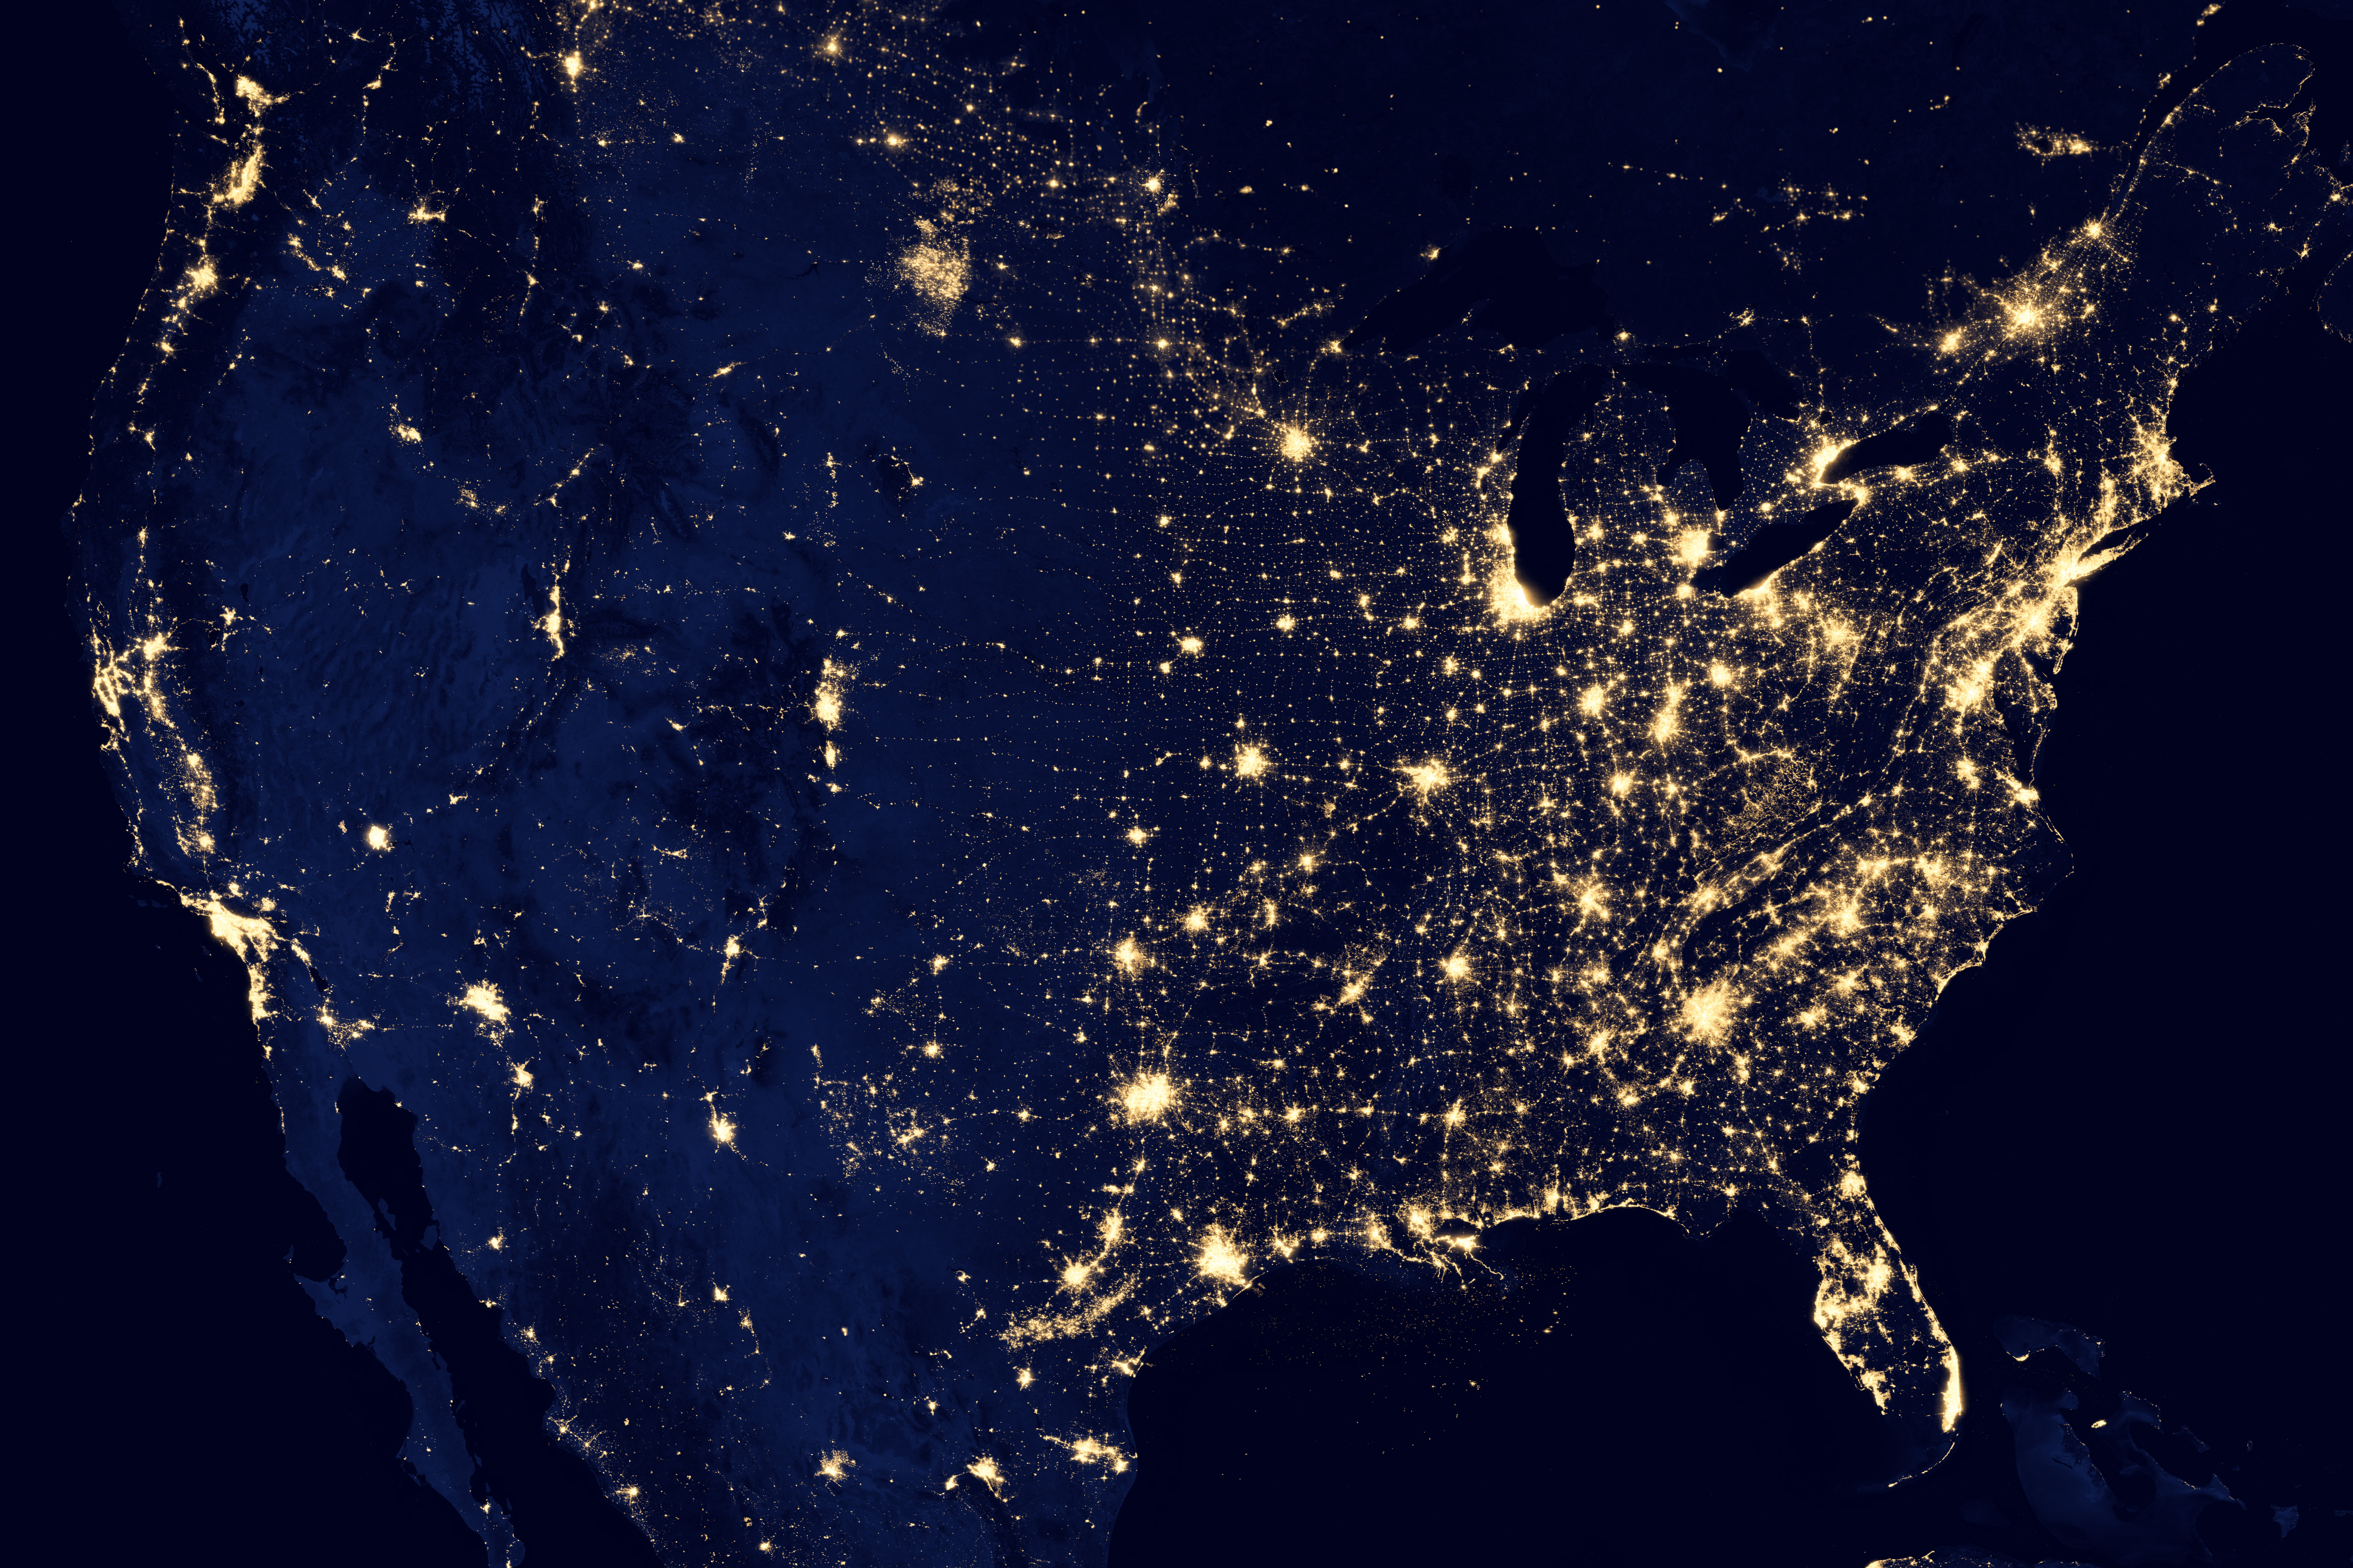
City Lights of the U.S. 2012
This image of the United States of America at night is a composite assembled from data acquired by the Suomi NPP satellite in April and October 2012. The image was made possible by the new satellite's “day-night band” of the Visible Infrared Imaging Radiometer Suite (VIIRS), which detects light in a range of wavelengths from green to near-infrared and uses filtering techniques to observe dim signals such as city lights, gas flares, auroras, wildfires, and reflected moonlight.
Read the article

| 
NASA Earth Observatory image by Robert Simmon, using Suomi NPP VIIRS data provided courtesy of Chris Elvidge (NOAA National Geophysical Data Center). Suomi NPP is the result of a partnership between NASA, NOAA, and the Department of Defense. Caption by Mike Carlowicz
|  ©Eastcott Momatiuk-Photodisc-Getty Images ©Eastcott Momatiuk-Photodisc-Getty Images
| Global Warming is Opening a Door for Ships
Melting Arctic ice will allow new shipping lanes to open, particularly the Northwest Passage, creating shorter transport times. Could global climate change have a silver lining in the form of improved international trade? Perhaps, if the fabled Northwest Passage finally becomes a reality. Melting Arctic ice will allow new shipping lanes to open, particularly the Northwest Passage, creating shorter transport times.
Read the article
| | | |

| 
| 
| |
The Center for Geographic Analysis (CGA) at Harvard University was established in 2006 to support research and teaching of all disciplines across the University with emerging geospatial technologies.
The Center's goal has been to work with entities across the university to strengthen university-wide geographic information systems (GIS) infrastructure and services; provide a common platform for the integration of spatial data from diverse sources and knowledge from multiple disciplines; enable scholarly research that would use, improve or study geospatial analysis techniques; and improve the ability to teach GIS and spatial analysis at all levels across the university.
The Center provides access to hardware, software and data, offers a wide variety of training programs that range from two hours to two weeks in duration, performs research project consulting, provides curriculum support, hosts a two-day conference annually, and develops tools and platforms for use with open source and proprietary GIS systems.
| Let's Get Connected
.MAP Conference
Leading Organizations for Mapping and Geographic Information Systems Create Event to bring the World of Print and Digital Mapmakers together
April 09, 2013 – Glencoe, IL and Mission Viejo, CA - In 2013, the International Map Industry Association (IMIA) and Directions Magazine will collaborate on a new event that brings the world of mapmakers together. The global conference, serving also as the IMIA's annual event, will be held September 08 - 10 at the Hyatt Regency Cambridge, in Cambridge, Massachusetts.
The objective of the conference is to gather professionals engaged in creating maps and mapping applications from both the print and digital world to explore new ways to deliver content, derive revenue, and design maps for a new audience in web, mobile and print. Mapmakers of the world will gather in one place to exchange ideas on how to better serve a growing audience for geographic information and present that information in a variety of formats including digital print, 3D printing, Internet portals, and mobile form factors.
“The new event is a tremendous opportunity for our membership to bring our collective knowledge of mapmaking to a new audience of digital cartographers working in Internet and mobile mediums,” said David Knipfer, president of IMIA (Americas).
|
Directions Media was founded in 1998 and published the first online magazine covering geospatial technology. Today Directions Media maintains several online publications and references including Directions Magazine, the All Points Blog, and GeoSpatial Webinars. It is the leading source of information, news and commentary in the fields of geospatial and location-based technologies. Directions Media has offices in Huntsville, Alabama and Glencoe, Illinois. More information can be found at www.DirectionsMedia.net.
The objective of the conference is to gather professionals engaged in creating maps and mapping applications from both the print and digital world to explore new ways to deliver content, derive revenue, and design maps for a new audience in web, mobile and print. Mapmakers of the world will gather in one place to exchange ideas on how to better serve a growing audience for geographic information and present that information in a variety of formats including digital print, 3D printing, Internet portals, and mobile form factors.
“As more people find new ways to use geographic information the responsibility to present that information in an understandable way rests with professionals in our community,” said Joe Francica, editor in chief of Directions Magazine. “Digital mapmakers must be cognizant that applications for mobile form factors and social networking apps must adhere to cartographic standards. As such there will be new methods of publishing and new business models to consider.”
|

|
| 
| 
| 
|
| First Full-View Photo of Earth
Photograph courtesy NASA Johnson Space Center
This famous "Blue Marble" shot represents the first photograph in which Earth is in full view. The picture was taken on December 7, 1972, as the Apollo 17 crew left Earth's orbit for the moon. With the sun at their backs, the crew had a perfectly lit view of the blue planet.
| First Photo of Earth From the Moon
Photograph courtesy NASA/Lunar Orbiter 1
This photo reveals the first view of Earth from the moon, taken by Lunar Orbiter 1 on August 23, 1966. Shot from a distance of about 236,000 miles (380,000 kilometers), this image shows half of Earth, from Istanbul to Cape Town and areas east, shrouded in night.
| First Color Photo of Earthrise
Photograph by NASA/Apollo 8 astronaut William A. Anders
When Apollo 8 was deployed in 1968, its sole photographic mission was to capture high-resolution images of the moon's surface, but when the orbiting spacecraft emerged from a photo session on the far side of the moon, the crew snapped this, the most famous shot of the mission. Dubbed "Earthrise," this view of the Earth rising from the horizon of the moon helped humans realize the fragility of their home.
|
|

|
| 
| 
MAPublisher
MAPublisher® transforms Adobe® Illustrator® into powerful map making software. MAPublisher bridges the gap between Geographic Information Systems and graphic design, providing the flexibility to make cartography fast, easy and efficient.
Features of MAPublisher include import and export all major GIS data formats, such as Esri shapefiles and geodatabases with all attributes and georeferencing intact, geospatial PDF export, MAP Web Author Flash export, automated labeling, and MAP Stylesheets.
Read the article
| 
Follow Esri Training on Twitter
Get Your Map Layout Tips Here
This short seminar teaches layout design essentials such as adding inset maps and using dynamic text.
Take a Map Tour
Visit the ArcGIS Online gallery, which contains some interesting maps and applications.
Video: Make Your Maps Stand Out
|
Which ArcGIS for Desktop Software is Right for You?
ArcGIS for Desktop allows you to analyze your data and author geographic knowledge to examine relationships, test predictions, and ultimately make better decisions.
Through your membership in the International Map Industry Association www.imiamaps.org
and contribution, the software is available in two license levels—Basic or Standard (formerly ArcView and ArcEditor respectively). These license levels share the same core applications, user interface, and development environment. Each license level provides additional GIS functionality as you move from Basic to Standard.
Read the article
|

|
| 
| Commemorate the National Geographic Society's 125th anniversary in 2013 with this new book featuring show-stopping imagery and thrilling behind-the-scenes tales, National Geographic 125 Years captures the heart of National Geographic's fascinating history, from its earliest days as a scientific club to its growth into one of the world's largest geographic organizations. The book reveals how much we've come to know about our fascinating world through the pages and unforgettable imagery of National Geographic, and taps key voices from the forefront of ocean and space exploration, climate science, archaeology, mountaineering, and many other disciplines to peer with us over the horizon and see where we are heading in the future.
No mere insider's account of internal affairs, National Geographic 125 Years focuses on the impact that the National Geographic Society has made on the world and how it has reported and reflected a dramatically changing planet. Special galleries between each of the sections focus on storytelling techniques pioneered by National Geographic, including photography, television, and digital reportage. These offer behind-the-scenes glimpses at the process of telling the greatest stories on earth.
To view 125 years in video format, please visit: http://www.nationalgeographic.com/125/videos/
| | | | | | | | | | | | | | |
_________________________________________________________________________________________

| 
| 
| .MAP Conference
Exhibitors to Date
Avenza Systems, Inc..
www.avenza.com
East View Cartographic
www.cartographic.com
Esri, Inc.
www.esri.com
Frederic Printing
www.fredericprinting.com
GM Johnson Maps
www.gmjohnsonmaps.com
Hema Maps Pty Ltd.
www.hemamaps.com.au
ITMB Publishing Ltd.
www.itmb.com
Linemark Printing
www.linemark.com
Mapping Specialists, Ltd.
www.mappingspecialists.com
Maps.com
www.maps.com
MapSherpa
www.mapsherpa.com
National Geographic Maps
www.natgeomaps.com
U.S. Geological Survey
www.usgs.gov
Vision Graphics Inc.
www.visiongraphics-inc.com
Williams & Heintz Map Corporation
www.whmap.com
| Mapping the Damage from Superstorm Sandy
When it hit the United States as a post-tropical cyclone, Sandy had a diameter of 1,100 miles and had been the largest Atlantic hurricane on record. It affected 24 states, including the entire Eastern Seaboard from Florida to Maine, causing particularly severe damage in New Jersey and New York. It clobbered the boarded-up big cities of the Northeast Corridor—including Washington, Baltimore, Philadelphia, New York, and Boston—with stinging rain and gusts more than 85 miles per hour. Storm surges, made worse by the full moon, caused high tides to rise about 20% higher than normal.
In the wake of the devastation wreaked by Sandy, dozens of federal, state, and local agencies, as well as many private companies, contributed to the response. Among others, the National Geodetic Survey (NGS) took aerial imagery of the damage, ImageCat helped to analyze the data, Pictometry took oblique imagery, Woolpert flew lidar, and Esri helped FEMA set up a geoportal.
Read the article
| Cartography Styles in Seekers of Lore
There are many ways to present campaign maps. Depending on the purpose, different map styles can be more appropriate than others. Seekers of Lore is going to be very much a sandbox campaign, with a great deal of exploration. There are two primary map styles I am considering.
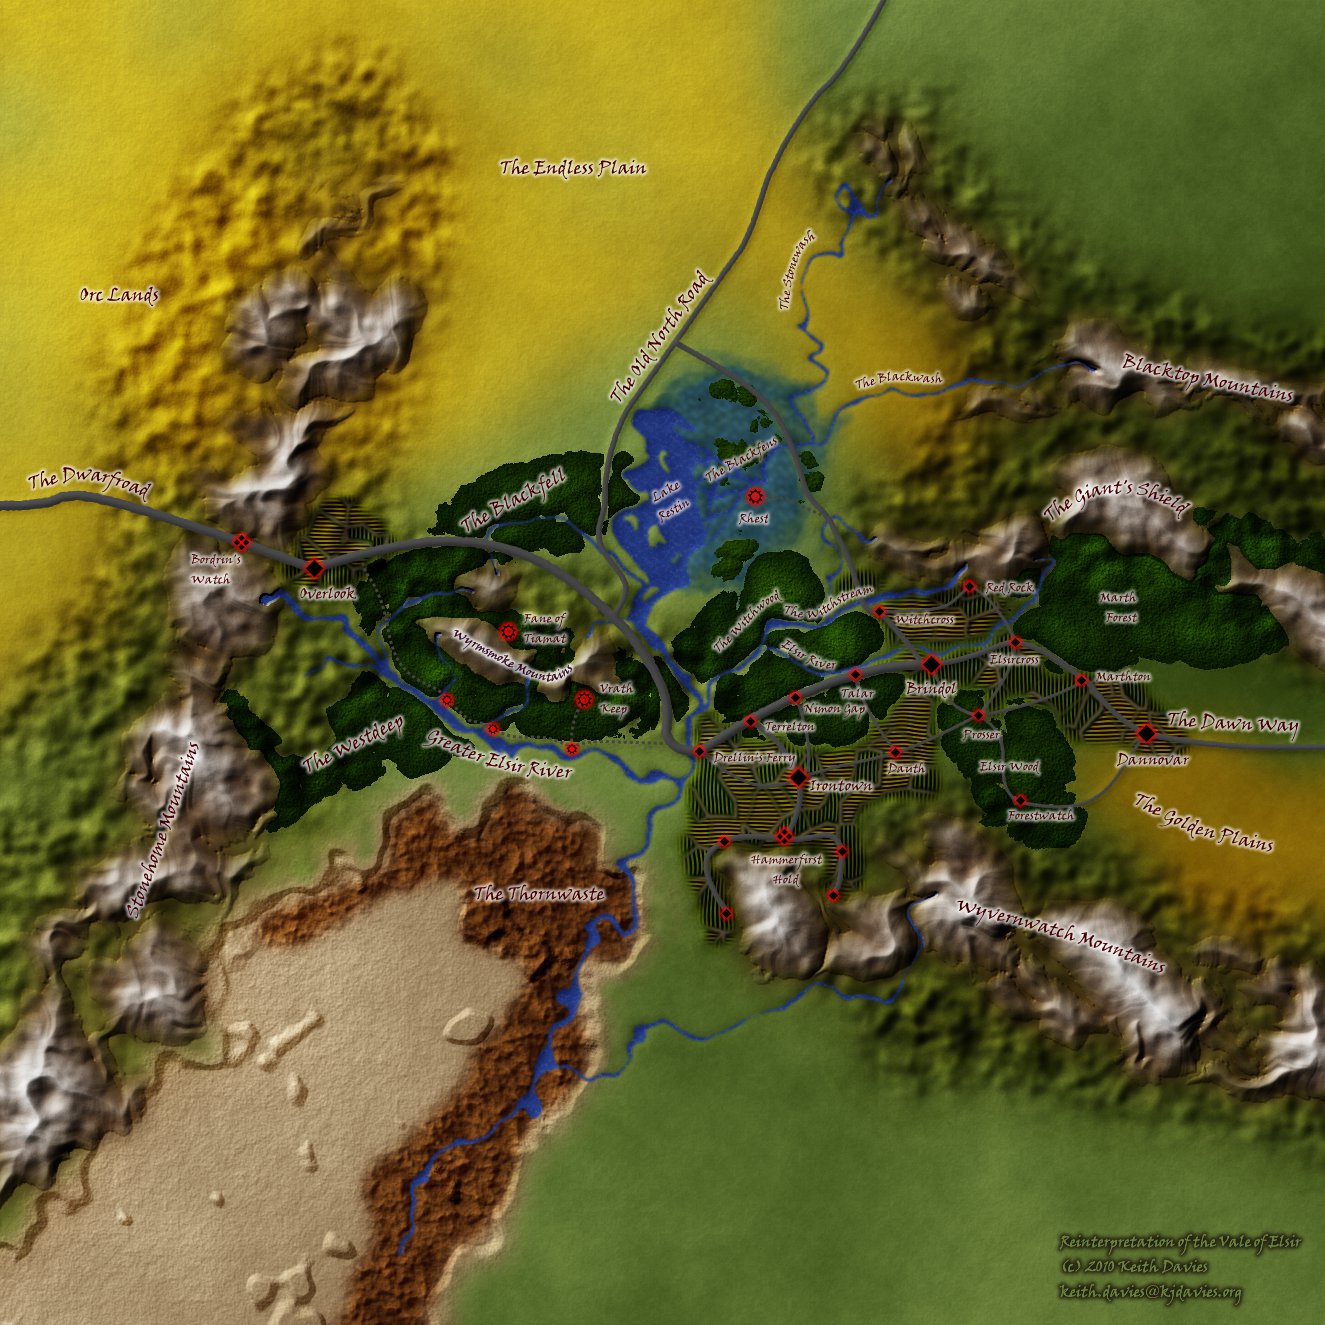
Artistic Maps
As a rule, I quite like ‘artistic’ maps. They don't really try to be true to life (the scales are often way, way off), but they do try to represent various geographical features in a way that looks more or less like those being represented. There are varying degrees of stylization to them and they may or may not be strictly accurate (mountain ranges are often presented in a way that says “there are mountains here” rather than individual placement).
These are often the prettiest maps, I think. They generally show signs of individuality and variation within the map. For instance, the same types of features (mountains, cities, forests, and so on) might look slightly or even significantly different from each other. For that matter, they are probably the most amenable to personal style and rendering skill because they are uniquely drawn.
Photo - Vale of Elsir, according to Nik
Read the article
|
___________________________________________________________________________________________
Calendar of Events
_________________________________________________________________________________________
The IMIA Report
The IMIA Newsletter is published by the International Map Industry Association.
IMIA International
President Charlie Regan
National Geographic Maps
1145 17th Street N.W.
Washington, DC 20036 USA
Tel: 202/775-7874
Fax: 202/429-5704
[email protected]
IMIA Headquarters
Sandy Hill, Executive Director
23052 - H Alicia Parkway, #602
Mission Viejo, CA 92692 USA
Tel: 949/458-8200
Fax: 949/458-0300
[email protected]
IMIA (Americas)
President David Knipfer
Mapping Specialists, Ltd.
3000 Cahill Main, Suite 220
Fitchburg, WI 53711 USA
Tel: 608/274-4004
Fax: 608/274-9689
[email protected]
IMIA (Asia Pacific)
President Brian Spier
Sibiz
PO Box 1694
Runaway Bay, QLD 4216 AU
Tel: +61 (0) 408 715782
Fax: +61 7 5537 8867
[email protected]
IMIA (Asia Pacific)
Noleen Zander, Executive Director
147 Unley Road
Unley, SA 5061 AU
Tel: 61 8 8357 1777
Fax: 61 8 8357 3001
[email protected]
IMIA (EAME)
Acting President Andreas Pachler
Karwendelstr. 7
Aufkirchen / Berg, D-82335 Germany
Tel: +49-81 51-5 55 15-60
Fax: +49-81 51-5 55 15-66
[email protected]
IMIA (EAME)
Howard Hudson, Executive Director
17 Tetbury Drive
Witney, Oxfordshire
OX28 5GF UK
Tel: +44 (0) 1993 74519
[email protected]
|
The IMIA Report is published bi-monthly by IMIA International and contains industry news and business advice for our members worldwide.
The e-magazine is written for the members as well as others interested in learning about mapping and the geospatial world. The IMIA Report welcomes submissions and ideas for feature articles.
Submit your press release and or article to IMIA Headquarters at [email protected]
International Map Industry Association
23052 - H Alicia Parkway #602
Mission Viejo, CA 92692 USA
Tel: 949.458.8200
Fax: 949.458.0300
[email protected]
www.imiamaps.org
|
|