
As the situation surrounding coronavirus disease 2019 (COVID-19) continues to evolve, Esri is supporting its users and the geospatial community at large with location intelligence, geographic information system (GIS) and mapping software, data, services, and materials that Esri’s users are leveraging to help monitor, manage, and communicate the impact of the outbreak. Esri invites the International Map Industry Association (IMIA) and geospatial community at large to use and share these resources broadly to help your community and organization respond effectively.
The following article will provide you with:
- Significant resources and technology from Esri users and Esri
- Great examples of organizations using ArcGIS to respond to COVID-19 and a Hub site to easily locate additional resources
- Insightful answers to geospatial professionals’ questions about differences in numbers on the GIS dashboards, and how to understand the underlying values represented in the data and the sources of that data
- High quality cartographic advice on mapping representation of COVID-19 data and the importance of being cartographically responsible with the visualization of the data
- The importance of evidence-based decision-making with GIS, and how to locate and use the available resources in response to the COVID-19 pandemic
1. First and foremost, it is important to share the resources and technology from Esri that can help organizations respond to the COVID-19 crisis, or any other disasters as they happen.
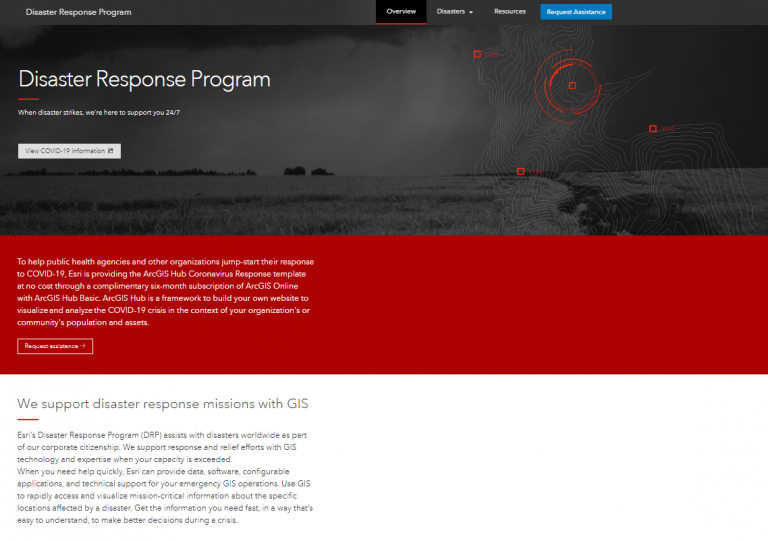
- The Esri Disaster Response Program, and its direct link to request assistance, provides resources, App templates, maps, data and live feeds to monitor, prepare for and respond to disasters, including the COVID-19 pandemic. Esri’s disaster response program was designed to approach disasters using GIS and has assisted in disaster and relief responses worldwide for over 20 years.
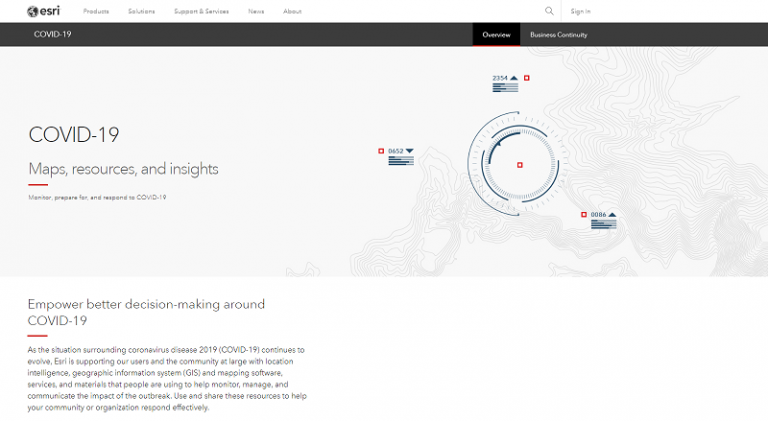
- The newly updated Esri COVID-19 resource site provides maps, resources and insights. As global communities and businesses seek to respond to the COVID-19 pandemic, including the GIS and mapping community, you can take five proactive steps to create an instant picture of your organization’s risk areas and response capacity. This includes; map the cases, map the spread, map vulnerable populations, map your capacity, and communications with maps.
- Esri’s external COVID-19 GIS Hub is a collection of authoritative resources to help organizations and communities understand, prepare for, and respond to COVID-19 in your community or organization. It provides ready-to-use maps, data, applications, templates, dashboards, and more for COVID-19. Check back often as these resources will be updated with new information as it becomes available.
- Esri will provide a COVID-19 Response Package for Ministries of Health and Global Outbreak Alert and Response Network (GOARN) partners. This will enable these organizations to access to Esri’s geospatial platform and tools that can be used for reporting and analyzing cases, deaths, public health and response activities at the national level. Additionally, at the local level there are tools to manage testing sites, communicate and organize community activities, understand impact, plan response and much more.
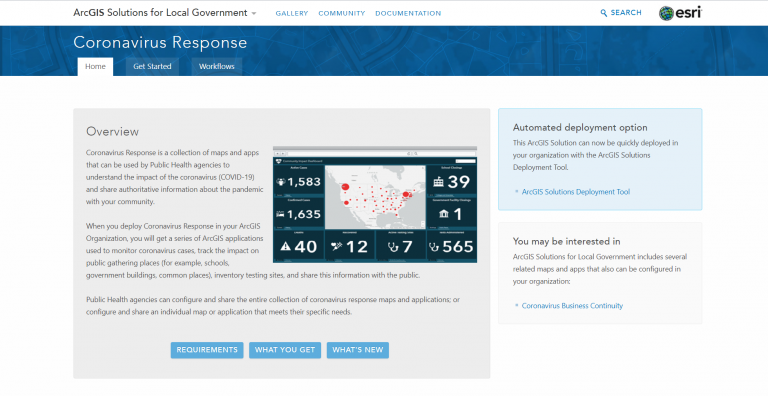
- The Coronavirus Response Solution is now available to deploy with ArcGIS. The first release of Coronavirus Response deploys a collection of maps and apps turning ArcGIS into a system to help public health agencies and communities respond to the evolving COVID-19 pandemic and be an authoritative source of information for the public. Public Health agencies can easily configure and share the entire collection of no-code coronavirus response maps and applications; or configure and share an individual map or application that meets their specific needs.
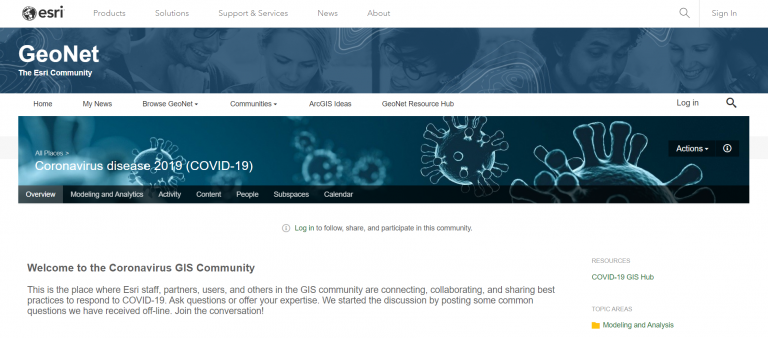
- GeoNet Coronavirus disease 2019 (COVID-19) site is the Coronavirus GIS Community. This is the place where Esri staff, partners, users, and others in the GIS community are connecting, collaborating, and sharing best practices to respond to COVID-19. The GeoNet community allows users to ask questions or offer their expertise, creating open dialogues and collaborative solutions and ideas.
 Be sure to bookmark and return to the above links often as more GIS resources will be regularly added.2. There are many examples of current organizations using Esri technology to respond to COVID-19. Here are two great examples of dashboards that have been widely published and used:
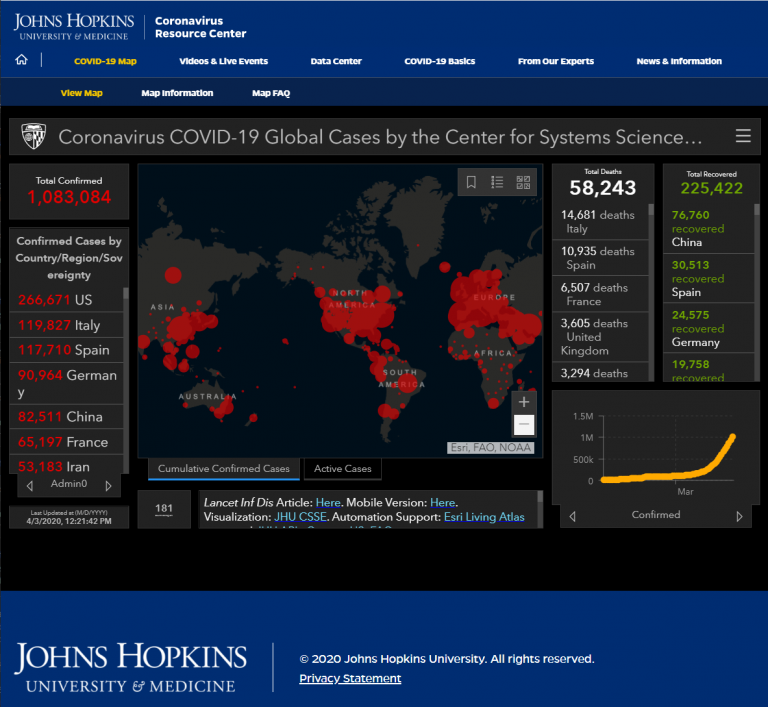
 - The Johns Hopkins University & Medicine Coronavirus Resource Center Dashboard, which is one of the most widely used resources out there and being shown strongly by the media. It is created by The Center for Systems Science and Engineering (CSSE), a research collective housed within the Department of Civil and Systems Engineering (CaSE) at Johns Hopkins University (JHU). (BTW – it does NOT contain any malware and NEVER contained malware, despite misinformation related at a counterfeit website).
- The World Health Organization (WHO) Coronavirus disease (COVID-19) Situation Dashboard.
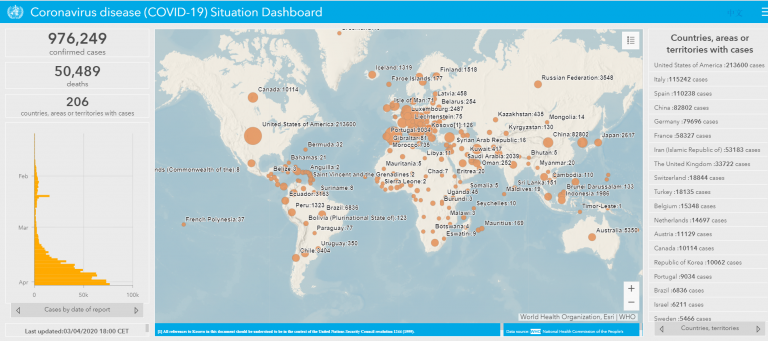
Both dashboards are examples of how location data can be visualized and provided as an authoritative resource of information. Understanding the “where” as shown in both above dashboards can help countries, communities, and organizations with allocating resources appropriately and proactively responding to the crisis. Many more resources like these are available at Esri’s external COVID-19 GIS Hub.3. As geospatial professionals in the International Map Industry Association you are probably wondering why there are differences in numbers on the dashboards and how organizations report and use data using each of these resources. It is important to read the Metadata (data about the data) to understand the underlying values representing the data and the sources of that data. Let’s take for example, the two dashboards above. -
- The World Health Organization (WHO) Coronavirus disease (COVID-19) Situation Dashboard is part of the WHO Health Emergency Dashboard. The events displayed are a subset of those reported through official channels as mandated by the International Health Regulations (IHR 2005). This includes national public health services around the world. Additional information can be found by selecting the ‘I’ Information button in the upper central right of the WHO Health Emergency Dashboard.
- Johns Hopkins University & Medicine Coronavirus Resource Center Dashboard The data sources listed in COVID-19 Map FAQs include the World Health Organization, the U.S. Centers for Disease Control and Prevention, the European Center for Disease Prevention and Control, the National Health Commission of the People’s Republic of China, local media reports, local health departments, and the DXY, one of the world’s largest online communities for physicians, health care professionals, pharmacies and facilities. 1point3acres, Worldometers.info, BNO, state and national government health departments, and local media are also used. The dashboard was developed to provide researchers, public health authorities, and the general public with a user-friendly tool to track the outbreak as it unfolds. All data collected and displayed are made freely available through a GitHub repository, along with the feature layers of the dashboard, which are now included in the Esri Living Atlas. For a detailed explanation for the dashboard’s development, please refer to this article in The Lancet by Professor Lauren Gardner, the originator.Note: It is important to note that while Esri’s ArcGIS is being used by many organizations to respond to COVID-19 with Esri’s support, it is its GIS users who are providing the authoritative apps, maps and data.
4. The Mapping community can play a critically important role in the cartographic representation of COVID-19 data and being cartographically responsible with the portrayal of the data. It is important to communicate this data as accurately as possible to assist health professionals, governments and organizations to accomplish many operations such as; tracking the disease to help scientists determine its cause and behavior, creating maps of hard-hit areas to alert residents and locating vulnerable populations to inform evidence-based response. These resources can help you consider how to best map your COVID-19 response.
- Improve your COVID-19 maps with five key points for mapping. This is a StoryMap addressing challenges in the literal mapping and map design of the COVID-19 count – where to get data, and how to visualize useful information. This is a step-by-step guide on how to create a map with useful and relevant information.
- Mapping Epidemics: From SARS, Zika and Ebola to the Pandemic of COVID-19 An article written by Este Geraghty, MD, MS, MPH, GISP on how governments and health organizations use GIS mapping to slow the spread of viruses like SARS, Zika, Ebola, and COVID-19.
- Age and Social Vulnerability in the Context of Coronavirus This is a step by step walkthrough by Esri Cartographer John Nelson on how to create a map by addressing Data, Visualization, and Clarity, and then telling a story with that map data through an Esri StoryMap. Story telling through mediums such as StoryMaps allows data to reach and be understood by broader communities and decision makers, and to maximize their impact.
5. Last, but most important, is using the technology, data and maps in GIS to guide evidence-based decision-making.
- This StoryMap on Dashboarding Coronavirus is full of examples of dashboards and information products to support decision-makers with trusted, easy-to-understand tools to confidently make better decisions.
- Business Continuity tools are available to help businesses, utilities, and government agencies share updates about facilities impacted by the coronavirus with stakeholders. Esri has made a variety of turnkey options available to all ArcGIS Online customers. The Coronavirus Business Continuity Solution is a collection of maps and apps to maintain business operations and share authoritative information with customers and stakeholders. The Hub template enables you to rapidly build a website that provides authoritative information to customers and share the critical steps you are taking to continue business operations with internal stakeholders.
- A good example of a GIS decision support tool is the implementation of the University of Pennsylvania’s COVID-19 Hospital Impact Model for Epidemics (CHIME) for use in ArcGIS Pro 2.5. This tool leverages SIR (Susceptible, Infected, Recovered) modeling to assist hospitals, cities, and regions with capacity planning around COVID-19 by providing estimates of daily new admissions and current inpatient hospitalizations (census), ICU admissions, and patients requiring ventilation.
- The Public Health Preparedness: A Geographic Approach White Paper is a free resource to inform GIS and Health professionals. The current COVID-19 pandemic presents an opportunity to build on the experience and readiness of Esri’s existing global user community in health and human services. Through real-time maps, apps, and dashboards, GIS will also facilitate a seamless flow of relevant data as a component of the response from local to global levels.
IMIA members know that maps are not just about pretty wall hangings and GIS is not merely intriguing geographic analysis tools. Now the world is literally seeing how GIS can be used to harness data science and The Science of Where to support life-giving decisions with data and analytics. GIS driven maps are the powerful way people around the globe are seeing the threats and visualizing the solutions to this invisible COVID-19 pandemic threat.
Article written by Esri’s Mark Cygan, Director of National Mapping Solutions and Kelley Moreno, National Mapping & Statistics Specialist