Every year, two exemplary maps are chosen from the hundreds of entries in the Map Gallery of the Esri User Conference to receive the prestigious ICA-IMIA Excellence in Cartography Award. This award is jointly sponsored by the International Cartographic Association and the International Map Industry Association. Presented annually since 2016, this award promotes and recognizes excellence in map design and advancement in cartography. Judges select from all registered submissions in the Map Gallery the two maps that they have determined best exhibit excellence in all aspects of cartographic design and production. This year, the Esri Virtual Map Gallery included over 350 maps for print or digital presentation. See all of the submissions, and even filter by winners, at this link until the end of July: linked here.
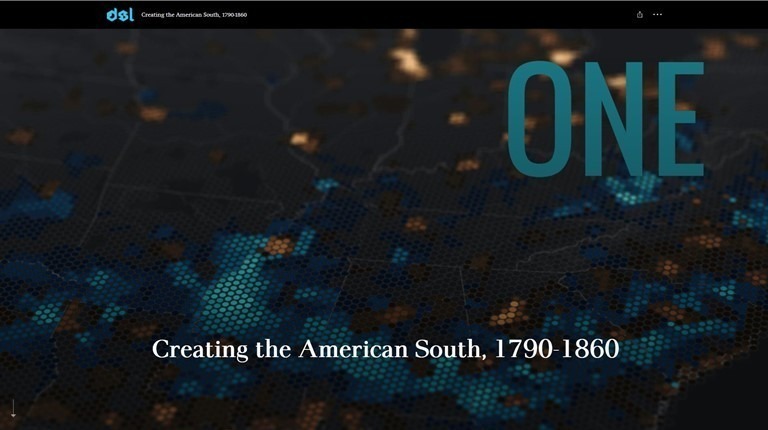
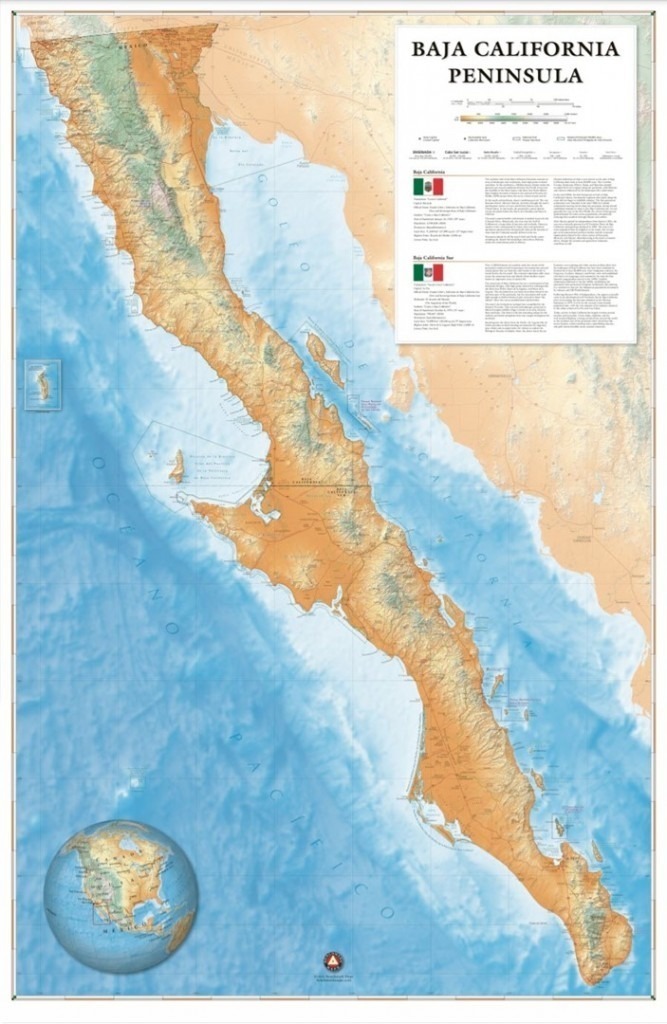
One of this year’s two winners is the printed wall map by Benchmark Maps titled “Baja California Peninsula”. The other winner is a StoryMap by Justin Madron, Nathaniel Ayers, and Ed Ayers titled “Southern Journey: The Migrations of the American South, 1790-2010”. Read on for links to the maps and justifications for why these maps were chosen to receive this year’s awards.
Baja California Peninsula by Benchmark Maps:
The artistry and accuracy of this map will appeal to even the most critical cartophiles. The vibrant colors and striking layout for this difficult-to-map elongated geography offer an expansive overview that draws readers in to examine the map close-up. They are rewarded with interesting and informative content that reflects cartographic expertise in planning, placement, and precision. Intuitive, clear, and classic, this map exemplifies the highest level of artistic and scientific treatment of all its fundamental cartographic elements. From the big picture to the smallest details, the map is stunning cartographic accomplishment.
Using a myriad of mapping methods, this StoryMap delivers a riveting narrative of the interwoven complex causes of the ebbs and flows that have shaped the southeastern United States. The dominant eye-catching topaz-and-turquoise honeycomb maps are highly effective in intentionally addressing the ambiguity of inconsistent geographic areas over time. A commanding control of various StoryMap capabilities shapes this chronical with engaging interactive maps and animations.